One of the sections of eBird that is most useful and appreciated by the majority of its users is “View and explore data.” Exploring data on eBird will allow us to learn so much about bird populations and develop strategies for conservation.
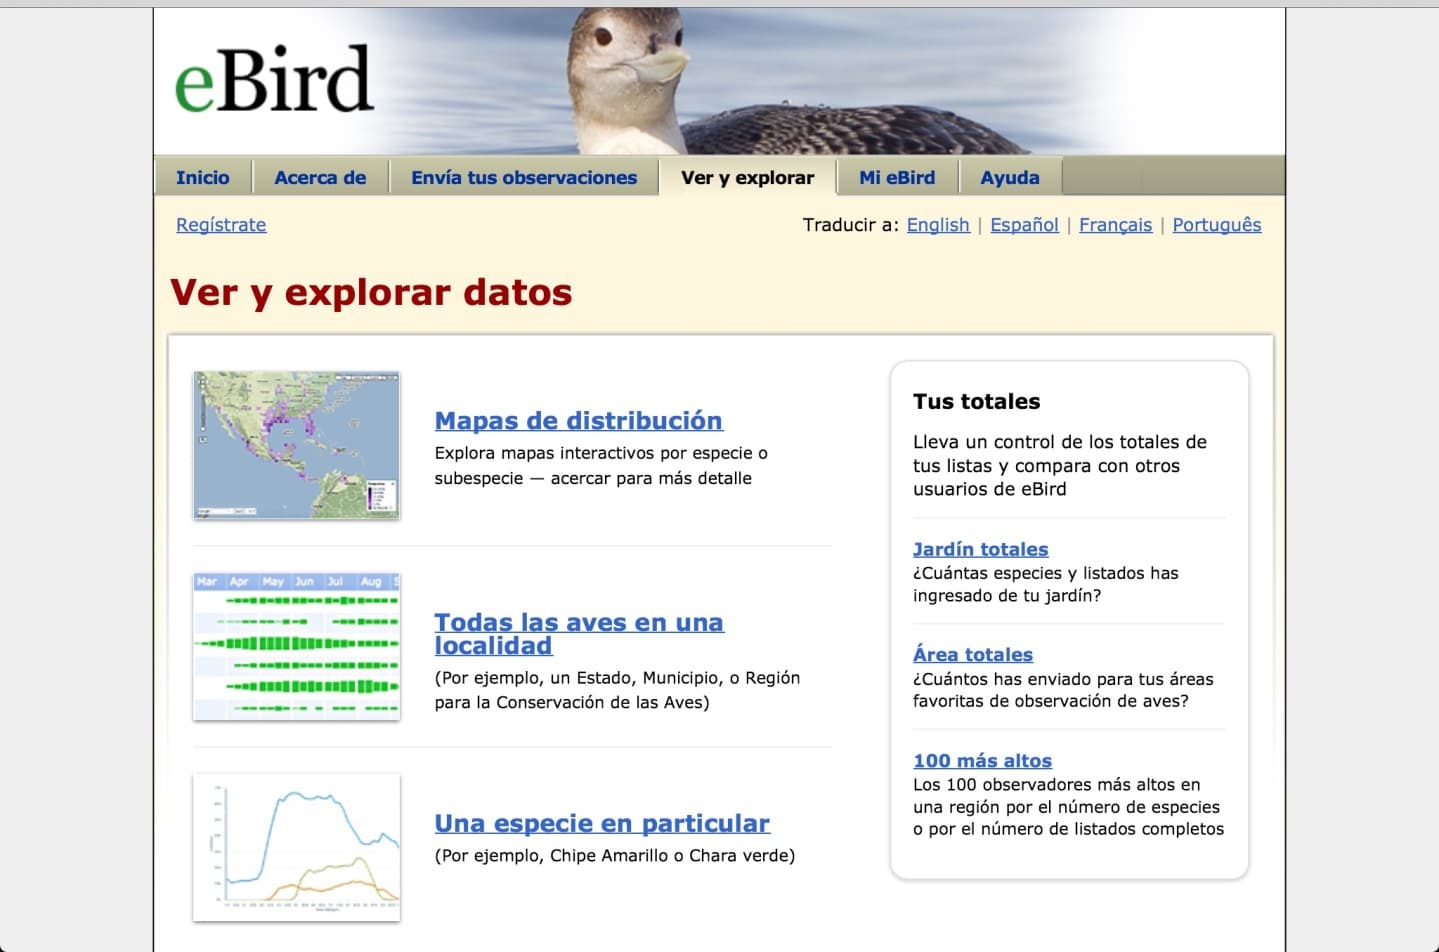
Main menu under “View and explore data”
Here, we can make use of eBird’s huge database, which features millions of bird sightings worldwide. It is an invaluable tool for both scientists and amateur ornithologists. It can be used to calculate parameters such as the abundance of a species in a given region, extract the list of species in a locality, study the phenology of different species, and the list goes on and on.
Distribution Maps
But the most used application and that which is attracting a greater number of users is undoubtedly “Distribution maps”. Its usefulness lies in the fact that we can look at the sightings of all the other eBird users on an interactive map. It is great help when planning a trip to the field.
Upon entering “Distribution Maps” you will find a search engine where you can type the name of the species for which you would like more information. You may search for a species either by its common name or its scientific name.
Then you will find a temporary filter, through which you can select the dates for which you want to get species information. This is useful if you want to learn more about the presence of a species in a particular season or if the species might be observed during the date of your visit.
This section also has a historical filter, through which one can access sightings that are several decades old.
Exploring Observations
And finally, we can use this tool to determine the presence of species of interest in the areas that we will visit.

Relief map with Eurasion Coot (Fulica atra) sightings in Spain. Sightings are indicated by squares whose color varies according to frequency.
On the right side of the map you will see a menu that lets you select different types of maps (Relief, Road, Satellite or Hybrid).
This allows you to see user observations in the form of dots or squares. Normally the use of exact points is more useful for estimating the location of sightings.
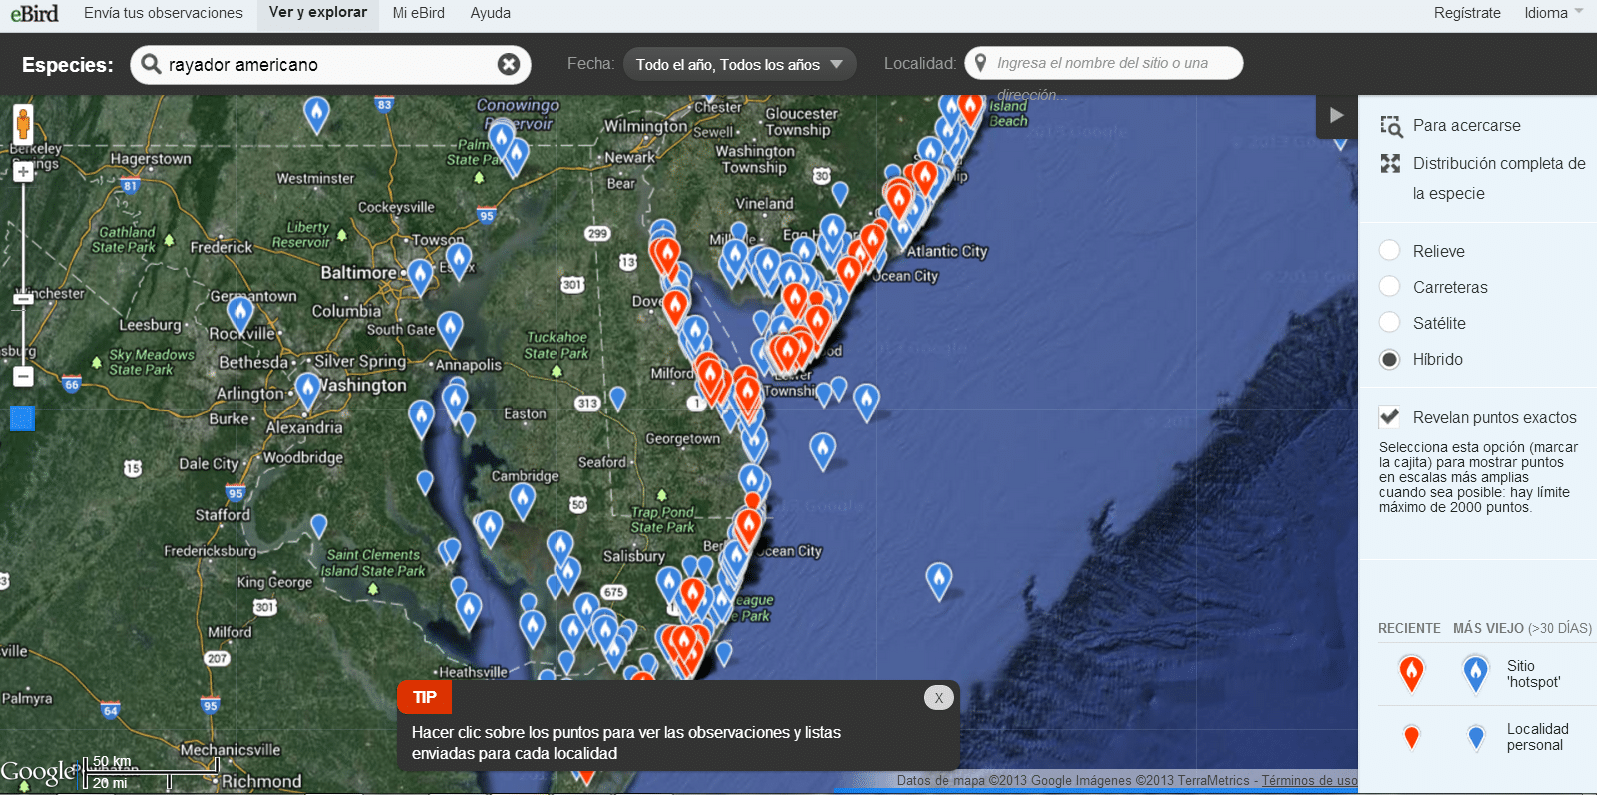
Hybrid Map with sightings of Black Skimmer (Rymchops niger) on the east coast of the United States. The records appear as exact points. The volume of citations is crucial to the eBird project.
Points on the map are orange if the sighting was made less than a month ago, or blue if the sighting is older. This makes it easier for us when selecting records closer to the date of our visit.
A very important aspect of this project is the volume of citations, since the greater the number of citations, the more reliable and more complete the information we have about the birds in our region. This will greatly facilitate the planning of birding trips.
eBird is becoming the largest scientific tool in the world of ornithology and we can help with this effort. Exploring data on eBird contributes greatly to the conservation of bird species worldwide. So, we at Whitehawk would like to encourage all birders to share their sightings through eBird and thus promote our knowledge of birds worldwide.